
Key Takeaways
- 1The RX 9060 XT 16GB at $389 beats the RTX 5060 Ti 8GB’s $379 asking price the moment a game hits 4K, where the 5060 Ti’s 8GB frame buffer collapses to 1-2 FPS in Stalker 2 at Epic settings.
- 2Skip the 8GB version of the RX 9060 XT entirely. Check the VRAM figure on every listing; the name alone won’t tell the two cards apart, and the 8GB one depreciates faster on resale.
- 3The Ryzen 5 9600X beats the Ryzen 7 5800X3D on NanoReview’s composite score, 71 to 52, while costing $175 against $346.81, and a Nanoreview reader poll backed that math with 82.1% picking the 9600X.
- 4Anyone still on AM4 and gaming-focused should keep the 5800X3D. It runs about 4.3% cooler than the Core i5-14600K and draws less power, even though the 14600K games about 8.3% faster at 1440p.
- 5The Core i5-14400F at $274 outscores the Ryzen 7 5700X at $310 across nearly every UserBenchmark category, and it already holds close to five times the 5700X’s market share.
- 6Owners of 13th or 14th Gen Intel desktop chips should install microcode 0x12B, or 0x12F if idle-voltage instability persists; Intel’s own testing found the performance cost falls within normal benchmark run-to-run variation.
- 7Baldur’s Gate 3, Stalker 2, Starfield, and Microsoft Flight Simulator all reward a faster CPU even paired with the 9060 XT, so a 5800X3D or 9800X3D-class chip matters specifically for these titles.
- 8Turning ray tracing off on the 9060 XT is the right call for most 1440p gaming, since the card averages just 65 FPS with RT on and drops to 26 FPS in Black Myth: Wukong.
- 9At MSRP the 9060 XT costs $5 per frame, beating the RTX 5060 Ti 16GB by 17%, but that edge narrows to just 9% once street prices climb to $430.
Table of Contents
- CPU-Bound vs GPU-Bound Games on the RX 9060 XT
- RX 9060 XT 16GB Specs and Market Position
- RX 9060 XT vs RTX 5060 Ti: Resolution Breakdown
- Tom’s Hardware’s Per-Game Results for the 9060 XT
- TechSpot’s Game-by-Game Numbers at 1080p and 1440p
- RX 9060 XT Ray Tracing Performance
- RX 9060 XT Power Draw and AIB Thermal Testing
- RX 9060 XT Cost Per Frame and the 8GB SKU
- The Rest of TechSpot’s 9060 XT Test Bench
- Ryzen 7 5800X3D on AM4
- Ryzen 7 5700X on AM4
- Core i5-14600K Against the Ryzen X3D Chips
- AM4 to AM5 Upgrade Economics
CPU-Bound vs GPU-Bound Games on the RX 9060 XT
Most of the games a 9060 XT owner runs will live or die by the GPU alone, but a handful of popular titles break that rule entirely. Baldur’s Gate 3, Stalker 2, Starfield, and both Flight Simulator releases all lean on the CPU hard enough that swapping the processor changes the outcome, not just the graphics card.
Baldur’s Gate 3
Pair a fast enough GPU with Baldur’s Gate 3 and the card runs out of work before it runs out of headroom, a pattern Tom’s Hardware found most pronounced at 1080p, where the CPU has to keep up with far more frames per second than it does at higher resolutions. A recent significant patch has already shifted how the game loads its CPU, which means whatever numbers exist for it today are a snapshot rather than a fixed target.
Stalker 2
Stalker 2 leans on the CPU more than most of what’s shipped recently, and Tom’s Hardware reports noticeable microstuttering as the symptom, not just a lower average frame rate. That stutter gets worse the longer a session runs, which is exactly the kind of problem a faster GPU can’t buy its way out of.
Starfield
Starfield runs on Bethesda’s updated Creation Engine 2, and it shows the same pattern as Baldur’s Gate 3: the lower the resolution, the more the CPU becomes the limiting factor, since the GPU is doing less work per frame and waiting on the processor to feed it more of them.
Microsoft Flight Simulator 2020 vs 2024
Flight Simulator 2020 favored AMD’s X3D chips specifically, the kind of preference that made a 9800X3D or 5800X3D genuinely worth chasing for that one game. Flight Simulator 2024 is more forgiving toward Intel CPUs, a change that lines up with its improved DirectX 12 code and the fact that it has dropped DX11 support outright. Which chip wins now depends on which version of the sim someone actually plays.
None of this holds for everyone, and one Radeon owner’s own upgrade shows the flip side of being GPU-limited rather than CPU-limited.
Recently went from 5600x to 5700x3d. Turns out, the games I often play are GPU limited, while the 1% lows are better, it was so not worth it.
RX 9060 XT 16GB Specs and Market Position
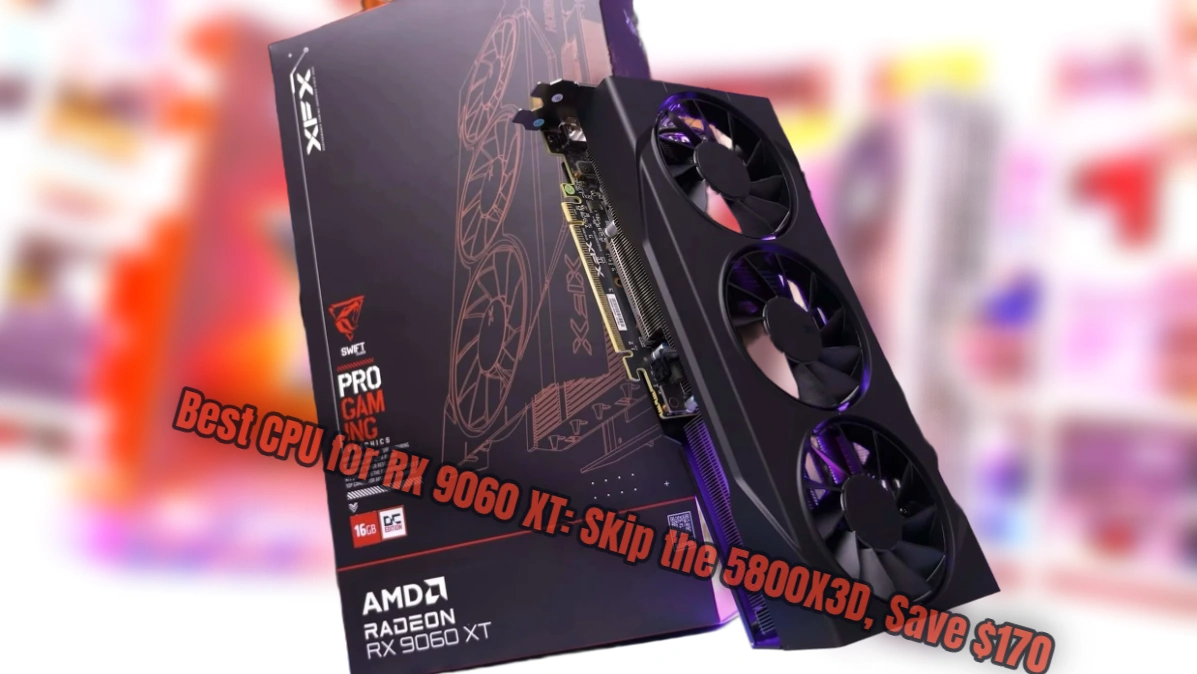
AMD set the RX 9060 XT 16GB at $350, roughly 20% below the 16GB RTX 5060 Ti, and GDDR6 rather than a newer memory standard is a big part of how that gap gets paid for. It’s the kind of decision that shows up directly in the bill of materials rather than in a spec sheet anyone reads twice, and it’s why AMD can undercut Nvidia by that margin without giving up the 16GB frame buffer that matters for the resolutions this card actually targets.
| Specification | Radeon RX 9060 XT 16GB | Radeon RX 7600 XT | GeForce RTX 5060 Ti 16GB | GeForce RTX 4060 Ti 16GB |
|---|---|---|---|---|
| MSRP | $350 | $330 | $430 | $500 |
| Boost Clock | 3130 MHz | 2755 MHz | 2572 MHz | 2540 MHz |
| Die Size | 199 mm² | 204 mm² | 181 mm² | 187.8 mm² |
| Memory Bandwidth | 320 GB/s | 288 GB/s | 448 GB/s | 288 GB/s |
| Total Board Power | 160W | 190W | 180W | 160W |
AMD’s 199 mm² die runs about 10% larger than the 181 mm² on Nvidia’s RTX 5060 Ti, silicon Nvidia isn’t spending that AMD is. Against its own predecessor the improvements are just as plain: the 9060 XT’s boost clock comes in 14% higher than the RX 7600 XT’s, and its memory delivers 11% more bandwidth, 320 GB/s against 288 GB/s. Both of those gains land on a card that also cuts total board power from 190W down to 160W, which is the generational leap that actually matters for anyone replacing a 7600 XT rather than cross-shopping Nvidia.
AMD also moved the 9060 XT onto a PCIe 5.0 interface, but at 16GB of memory the card was never going to be starved for bus bandwidth in the first place, so the newer interface doesn’t translate into anything a buyer will notice in games.
RX 9060 XT vs RTX 5060 Ti: Resolution Breakdown
At street prices, the RX 9060 XT 16GB runs $389 against the RTX 5060 Ti 8GB at $379, close enough that neither card can claim a value edge on sticker price alone. Whatever separates them has to come from the numbers, and Tom’s Hardware ran both across four settings: 1080p medium, 1080p ultra, 1440p ultra, and 4K ultra.
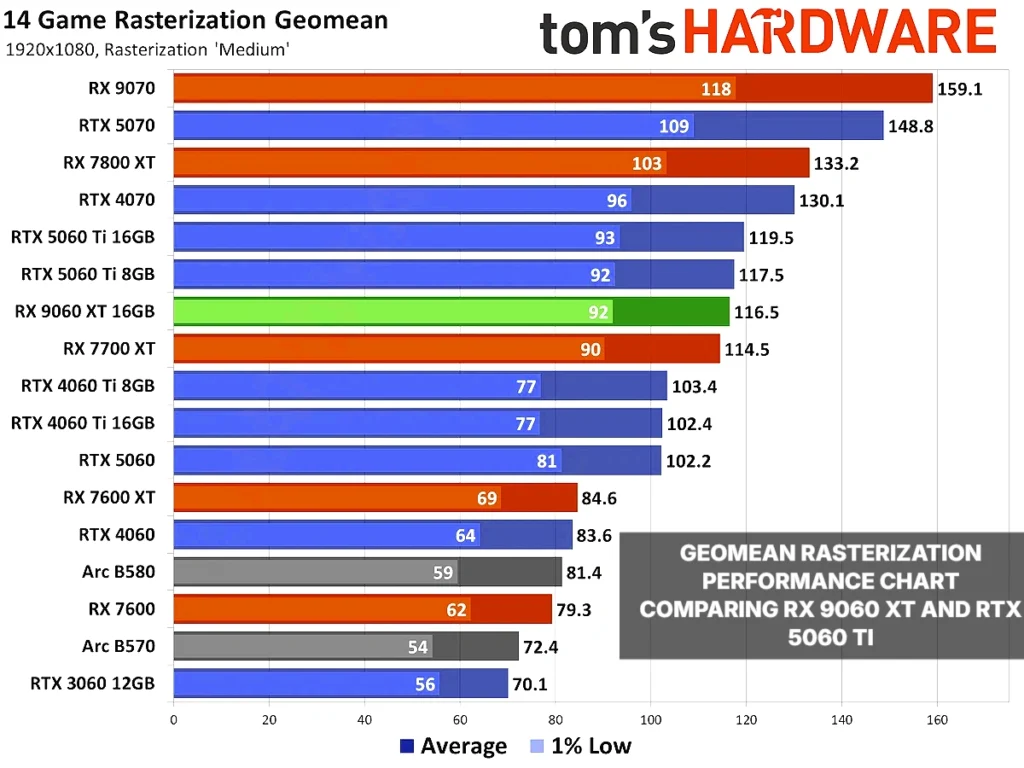
The two trade places as resolution climbs. Nvidia holds a slim edge at 1080p, AMD overtakes it at 1440p, and by 4K the gap between them stops looking like a close race at all.
| Test Setting | Winner | Performance Lead (Tom’s Hardware) |
|---|---|---|
| 1080p Medium | RTX 5060 Ti | 0.9% |
| 1080p Ultra | RTX 5060 Ti | 1.7% |
| 1440p Ultra | RX 9060 XT | 4.2% |
| 4K Ultra | RX 9060 XT | 50.9% |
A VRAM wall, not a performance win
A 50.9% lead at 4K ultra isn’t AMD pulling ahead on raw speed, it’s Nvidia’s 8GB frame buffer running out of room. Tom’s Hardware found several games nearly refusing to run on the 5060 Ti at that resolution, which means the 5060 Ti’s 1080p and 1440p wins tell you more about its real ceiling than its 4K numbers ever could.
How the 9060 XT stacks up against the rest of the field
Against the plain RTX 5060, the 9060 XT leads by 13-14% at 1080p, 28% at 1440p ultra, and 70% at 4K ultra, a gap that keeps widening the harder you push the resolution. The catch is the $90 the 9060 XT costs on top, and at 1080p that extra money buys a lead nowhere near proportional to the premium, so anyone gaming at 1080p specifically should weigh that math before assuming the pricier card is the smarter buy.
Set against its own predecessor, the RX 9060 XT is slightly faster than the RX 7700 XT at 1080p and slightly slower at 1440p and 4K, which makes this generation a side-grade in raw rasterization rather than a clear step forward, whatever gains AMD has made elsewhere in features or efficiency.
The gap over Intel’s Arc B580 is even wider, and it shrinks as resolution rises rather than growing: 40-43% at 1080p, 35% at 1440p, 28% at 4K. That lead would matter less if the B580 still sold near its $249 MSRP, but its street price runs $310 to $380, close enough to the 9060 XT’s $389 that Intel’s lower sticker price stops being the deciding factor.
Tom’s Hardware’s Per-Game Results for the 9060 XT
Fourteen games, one question running underneath every one of them: does the RX 9060 XT’s 16GB of VRAM matter more than whatever Nvidia’s architecture is doing under the hood. The answer changes title to title, and sometimes resolution to resolution within the same title, which is exactly why the aggregate numbers from the last section only tell half the story.
Assassin’s Creed Mirage
AMD opens with a win. The RX 9060 XT beats the RTX 5060 Ti by 16% at 1440p, and that lead only grows as the resolution climbs, hitting 21% at 4K. A gap that widens rather than narrows with resolution is the signature of a VRAM advantage doing its job.
Baldur’s Gate 3
Baldur’s Gate 3 flips the script, with the RX 9060 XT sitting slightly behind the RTX 5060 Ti on average frame rate. But its 1% lows at 1080p come out ahead, which means the AMD card is the one that stutters less even while averaging fewer frames.
Black Myth: Wukong
- Even with ray tracing off, Black Myth: Wukong runs better on Nvidia’s architecture
- The RTX 5060 Ti is 5-10% faster than the RX 9060 XT at 1440p and below
- At 4K, the RTX 5060 Ti’s 8GB of VRAM hits a wall and the advantage disappears
Dragon Age: The Veilguard
- At 1080p, the RTX 5060 Ti is 8% faster than the RX 9060 XT
- At 1440p, the RX 9060 XT takes over with a 13% lead
- At 4K, that lead balloons to 71%, the clearest sign yet of what 8GB of VRAM costs Nvidia’s card at higher settings
Final Fantasy XVI
Final Fantasy XVI is a clean sweep for AMD, with the RX 9060 XT leading by 8% to 17% at every resolution tested. A PlayStation port favoring AMD hardware across the board points to its console origins as much as to anything happening in VRAM.
Microsoft Flight Simulator 2020 and 2024
The two Flight Simulator games tell a story about where game demands are heading. In the 2020 release, the RTX 5060 Ti beats the RX 9060 XT by 1-8%. In the 2024 release, that result reverses completely: the RX 9060 XT leads by 10% at 1080p medium and by 122% at 4K ultra. Four years of engine development turned an Nvidia win into a rout, and it did it by asking for more VRAM than the RTX 5060 Ti’s 8GB can supply.
God of War Ragnarök
God of War Ragnarök runs the pattern seen in Dragon Age and Black Myth in miniature. The RTX 5060 Ti leads by up to 10% at 1080p and 1440p, then the RX 9060 XT takes over at 4K with a 9% lead of its own.
Horizon Forbidden West
- At 1440p, the RX 9060 XT’s lead grows to 34%, translating to 74 FPS against the RTX 5060 Ti’s 55 FPS
- At 4K, that lead reaches 85%
- This is one of the strongest cases in the suite for the 9060 XT among anyone gaming at 1440p and above
The Last of Us Part 1
The Last of Us Part 1 has a reputation for being heavy on VRAM, and the results back that up. The RX 9060 XT leads by 7-12% even at 1080p and 1440p, then that lead jumps to 73% at 4K, where the RTX 5060 Ti’s 8GB starts running out of room.
A Plague Tale: Requiem
A Plague Tale: Requiem is an Nvidia-promoted title, and the RTX 5060 Ti holds a 4-8% lead across every resolution tested, 4K included. Unlike Dragon Age or Horizon, VRAM headroom never flips this one; the RTX 5060 Ti’s advantage here just isn’t a VRAM story.
Stalker 2
- At 4K Epic settings, the 8GB RTX 5060 Ti collapses to 1-2 FPS, a slideshow rather than a game
- The 16GB version of the RTX 5060 Ti manages a playable 30 FPS at the same settings
- The RX 9060 XT 16GB trails that 16GB Nvidia card, landing at 25 FPS
Starfield
Starfield is an AMD-promoted title, which makes it the odd one out: the RTX 5060 Ti generally leads anyway, and the RX 9060 XT only wins at 1080p medium settings. A partnership with AMD guaranteed nothing here.
Warhammer 40,000: Space Marine 2
Space Marine 2 closes the suite on the RX 9060 XT’s worst result across all fourteen games, trailing the RTX 5060 Ti by 21-22% at both 1080p and 1440p despite being another AMD-promoted title. A gap that size in a game AMD helped bring to market points squarely at driver tuning rather than anything fixed in silicon.
TechSpot’s Game-by-Game Numbers at 1080p and 1440p
TechSpot built its 18-game rasterization suite around a Ryzen 7 9800X3D, the fastest gaming CPU AMD sells. That matters for how these numbers should be read: a rig this far ahead of what most 9060 XT buyers will actually run removes the CPU as a variable almost entirely, so what shows up title to title is close to a pure measure of the GPUs themselves.
The Overall Verdict at Each Resolution
At 1080p, the RX 9060 XT landed 6% behind the RTX 5060 Ti overall, a gap TechSpot summed up by calling the card’s performance ‘7700 XT-like’. That label works both ways: it’s 4% ahead of the actual RX 7700 XT, so anyone still running that card gets a real generational bump, even while Nvidia keeps a small edge at the same resolution.
Push the resolution up to 1440p and the gap nearly disappears: TechSpot put the two cards within a frame or a percent of each other overall. Whatever separation Nvidia holds at 1080p isn’t an architectural advantage that scales, since it shrinks to noise once the GPU itself becomes the bottleneck instead of the CPU.
How the 18 Games Break Down
- Clair Obscur: Expedition 33 — RX 9060 XT 5% slower than the RTX 5060 Ti
- Oblivion Remastered, RX 9060 XT ahead by 11%
- Delta Force, RX 9060 XT trails by 10%, hitting 105 fps
- Stalker 2, the two cards neck and neck, both over 40 fps
- Counter-Strike 2, RX 9060 XT trails by 17%, averaging 331 fps
- Space Marine 2, RX 9060 XT 13% slower
- Jedi: Survivor (1440p), RX 9060 XT trails by 8%
- Black Ops 6, RX 9060 XT ahead by 32%, the single largest swing in either direction across the suite
- A Plague Tale: Requiem, RX 9060 XT edges ahead by 3%
- Starfield, RX 9060 XT 6% slower
- Cyberpunk 2077, RX 9060 XT trails by only 2%
- God of War Ragnarök, RX 9060 XT slightly ahead, averaging 101 fps
- Dying Light 2 (default DirectX 11), RX 9060 XT 18% slower, though switching the game to DirectX 12 makes the two cards much more comparable, pointing at the API path rather than the GPU as the source of that gap
- Dragon Age: The Veilguard, RX 9060 XT just 3% slower
- Spider-Man Remastered, RX 9060 XT beats the older RX 7800 XT by 10%
- Hogwarts Legacy, RX 9060 XT 5% faster
- The Last of Us Part I, RX 9060 XT 7% slower
- Star Wars Outlaws, performance between the two cards nearly identical
RX 9060 XT Ray Tracing Performance
Turn ray tracing on and the RX 9060 XT settles at 65 FPS averaged across TechSpot’s suite, 20% behind the RTX 5060 Ti overall. That single number hides more than it reveals, because the gap that produces it isn’t spread evenly across the games that make it up. In some titles the two cards are effectively the same purchase with ray tracing on, and in others the 9060 XT falls far enough behind that the setting isn’t worth touching.
Demanding Modern Titles
Alan Wake II is where the gap first opens up seriously: the RX 9060 XT manages just 31 FPS at 1080p with upscaling, well behind the RTX 5060 Ti. That’s a number that puts the game in awkward territory on either card, but it’s a clear loss for AMD specifically.
Alan Wake II Ray Tracing Performance (1080p Upscaled)
Black Myth: Wukong is worse still. At 26 FPS with ray tracing on, the RX 9060 XT is effectively unplayable in this title, and it’s roughly 50% slower than the RTX 5060 Ti here, the widest margin in the suite so far.
Black Myth: Wukong Ray Tracing Performance (1080p Upscaled)
Indiana Jones and the Great Circle follows the same pattern: 23 FPS on the RX 9060 XT, 45% slower than the RTX 5060 Ti, and neither number is one you’d want to play at. These three games together make the case that AMD’s ray tracing hardware genuinely struggles once a game leans on it heavily.
Indiana Jones and the Great Circle RT Performance (1080p Upscaled)
Cyberpunk 2077 tells a milder version of the same story: 14% slower at 1080p, an actual deficit but nowhere near what Alan Wake II or Black Myth: Wukong show. It’s a reminder that the 9060 XT’s RT weakness scales with how hard a game pushes the feature rather than being fixed at any one number.
Cyberpunk 2077 Ray Tracing Performance (1080p Upscaled)
Playable Ray Tracing Experiences
Spider-Man Remastered flips the entire narrative: both cards hit 123 FPS at 1080p with ray tracing on, a dead heat, and at 1440p the RX 9060 XT nearly matches the RTX 5060 Ti again. Whatever is dragging AMD down in Alan Wake II or Indiana Jones simply isn’t present here.
Spider-Man Remastered Ray Tracing Performance (1440p)
Metro Exodus Enhanced keeps the gap just as narrow, with the RX 9060 XT landing at 152 FPS against the RTX 5060 Ti’s 158 — under a 4% difference. Older, well-optimized ray tracing implementations are consistently where this deficit shrinks to something a buyer could reasonably ignore.
Metro Exodus Enhanced Ray Tracing Performance (1080p)
Which Games You Play Decides This, Not the Average
The 20% overall deficit TechSpot measured is real, but it’s built almost entirely out of a handful of the newest, heaviest ray tracing titles, where neither GPU actually delivers a frame rate worth playing at. In the older or better-optimized games where ray tracing is genuinely playable, the RX 9060 XT and RTX 5060 Ti land within a few frames of each other. The card to buy depends less on that 20% average than on whether your library looks like Alan Wake II or Spider-Man Remastered.
RX 9060 XT Power Draw and AIB Thermal Testing
Power Consumption Against the RTX 5060 Ti
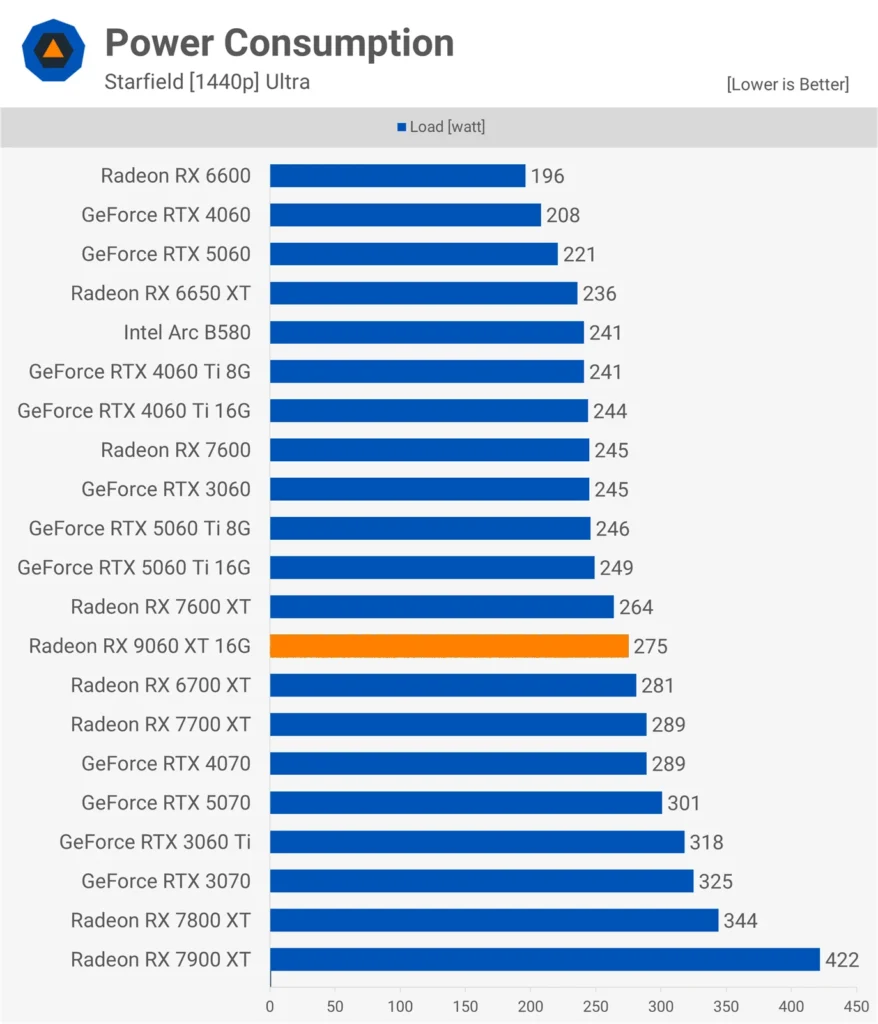
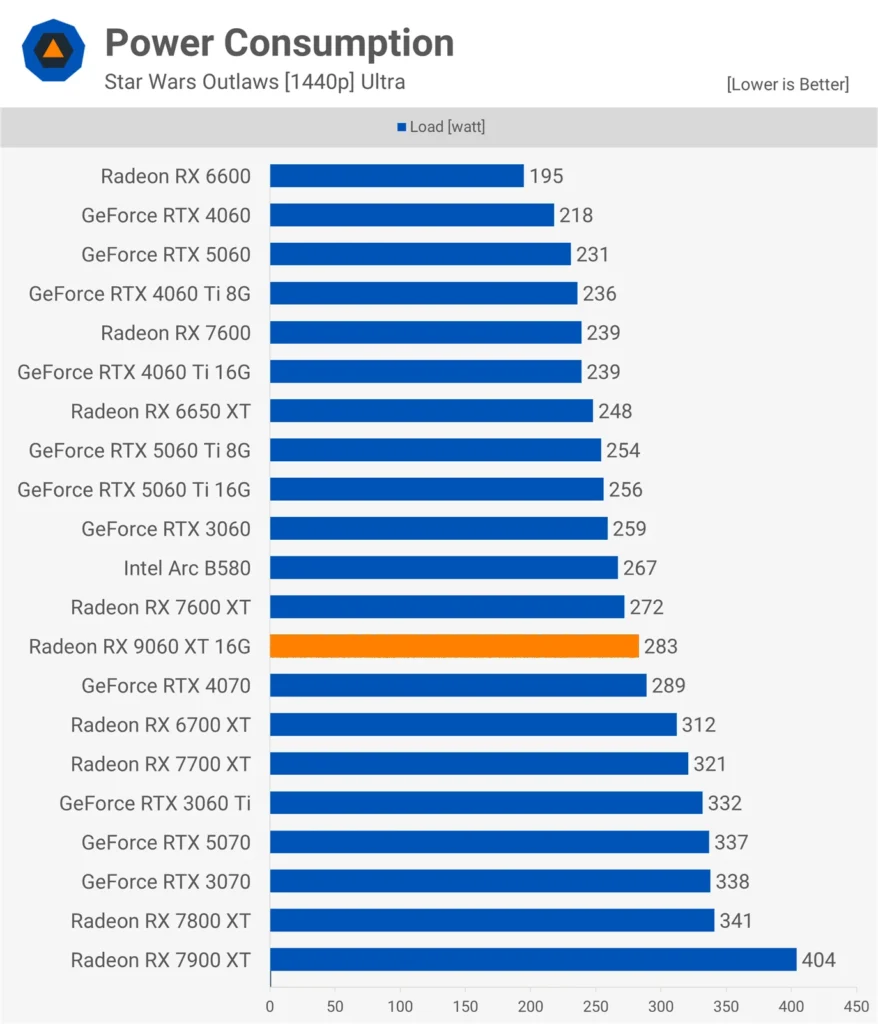
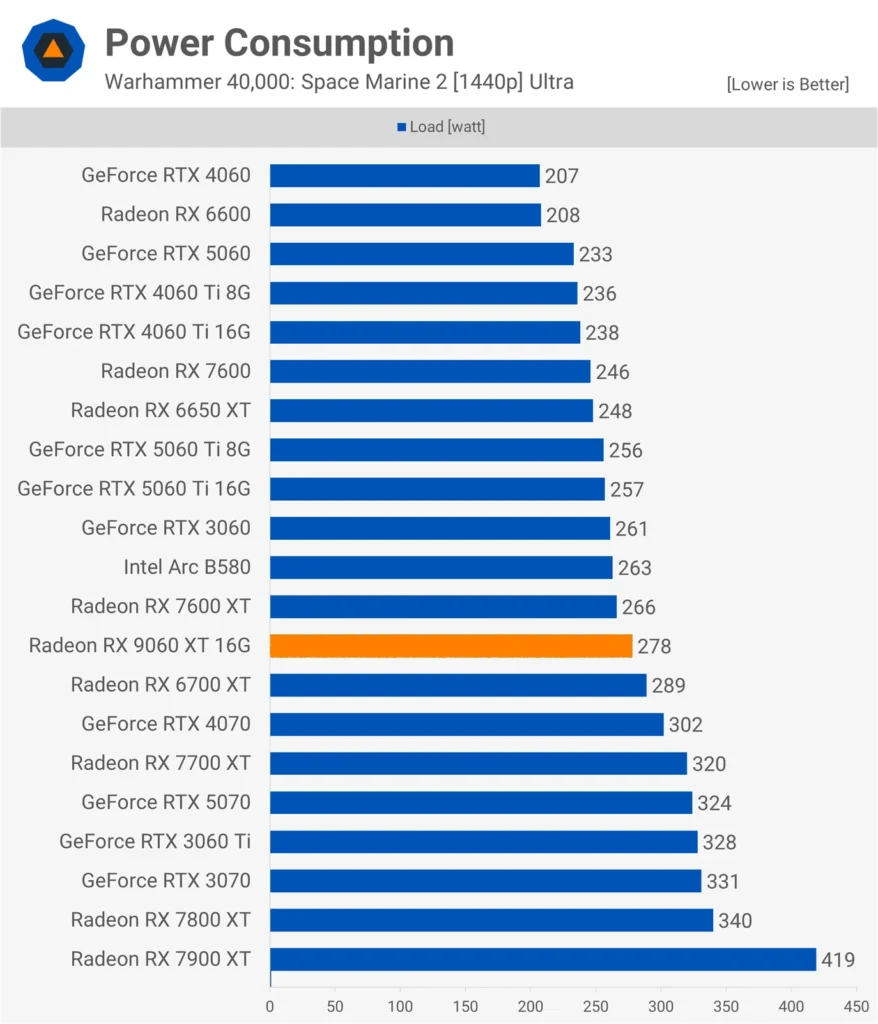
TechSpot’s numbers here are whole-system draw, CPU and GPU together pulled from the wall, not an isolated GPU-only figure. That matters for reading the gap between the two cards correctly: whatever separates the 9060 XT from the 5060 Ti in these charts sits on top of whatever the rest of the rig is already drawing, so the GPU-only difference is smaller than the raw wattage gap suggests.
Thermal Performance Across Four Partner Cards
TechSpot ran each of the four partner cards through an hour of F1 25 inside a closed ATX case at a room temperature of 21°C, long enough for any thermal design to settle into whatever steady state it’s actually going to hold under normal use rather than a fresh-boot best case.
| Model | Hotspot Temp (°C) | Fan Speed (RPM) | Memory Temp (°C) | VRM Temp (°C) |
|---|---|---|---|---|
| XFX Swift | 69 | 1400 | 80 | 71 |
| Asus Prime | 70 | 1550 | 82 | 62 |
| Asrock Steel Legend | 79 | 1000 | 85 | 75 |
| Sapphire Nitro+ | 79 | 1000 | 84 | 75 |
No single card in TechSpot’s four-way test wins on every front. The XFX Swift posts the lowest hotspot reading at 69°C while also running the highest clocks of the group, and the Asus Prime comes close behind it at 70°C, but only by spinning its fans up to 1550 RPM, well above anything else in the table. Trade that quiet for heat and the Asrock Steel Legend and Sapphire Nitro+ both settle at a 79°C hotspot while holding their fans to 1000 RPM, a full 10°C hotter than the XFX card for a noticeably quieter card. VRM cooling splits the same way: the Asus Prime holds its VRMs to 62°C, well below the 71°C on the XFX Swift and the 75°C shared by the Asrock and Sapphire cards, so the quietest-running option here also runs the coolest where it counts for long-term reliability. Buyers picking among these four are really choosing which discomfort they’d rather live with, fan noise or a warmer chip, since none of the four cards avoids both.
RX 9060 XT Cost Per Frame and the 8GB SKU
AMD’s claim of performance parity with the RTX 5060 Ti held up under testing, and the number behind that claim is 70 FPS averaged across 18 games at native 1440p. That’s a real 1440p card, not one that needs its resolution dialed back to stay playable, and it’s the baseline everything about its value has to be measured against.
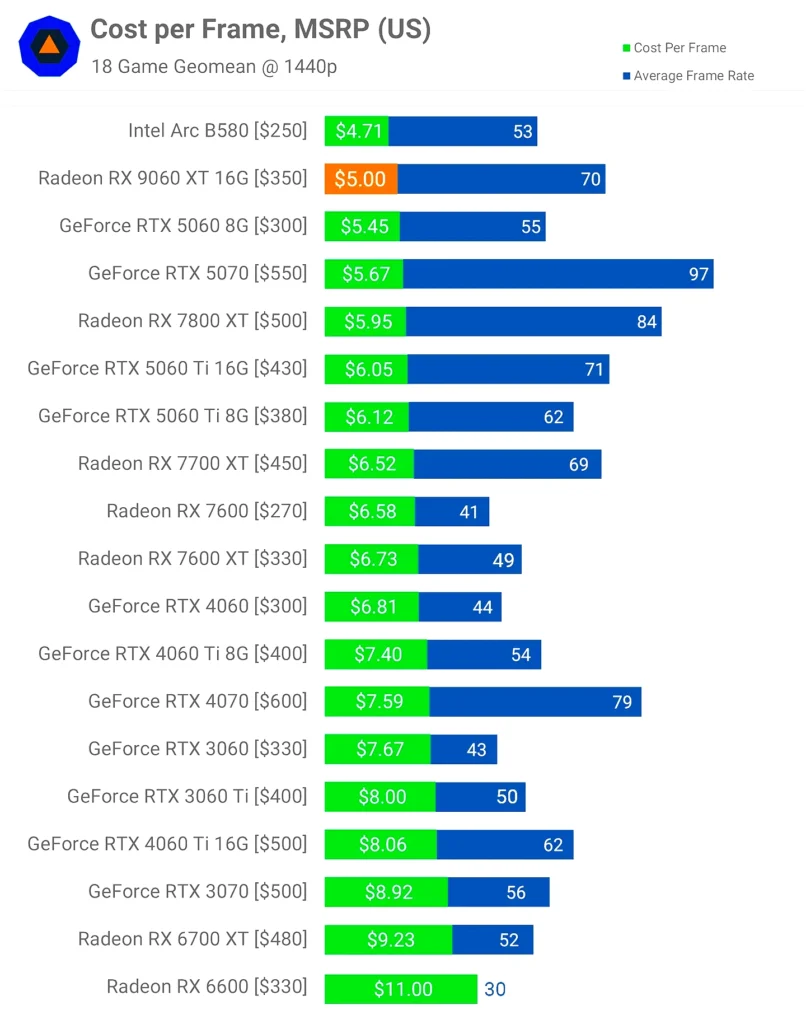
- At MSRP, the 9060 XT costs $5 per frame, just 6% more than Intel’s B580, close enough that the price gap barely matters
- It delivers 17% better value per frame than the RTX 5060 Ti 16GB, the closest thing it has to a direct rival
- For just $50 more than a plain RTX 5060, the 9060 XT makes that card largely irrelevant
Against AMD’s own last generation, the gap is even starker: the 9060 XT delivers 43% more performance than the 7600 XT it replaces. That’s the number that matters most at MSRP, but MSRP is a starting point, not where these cards actually sell, and the math shifts once street pricing takes over.
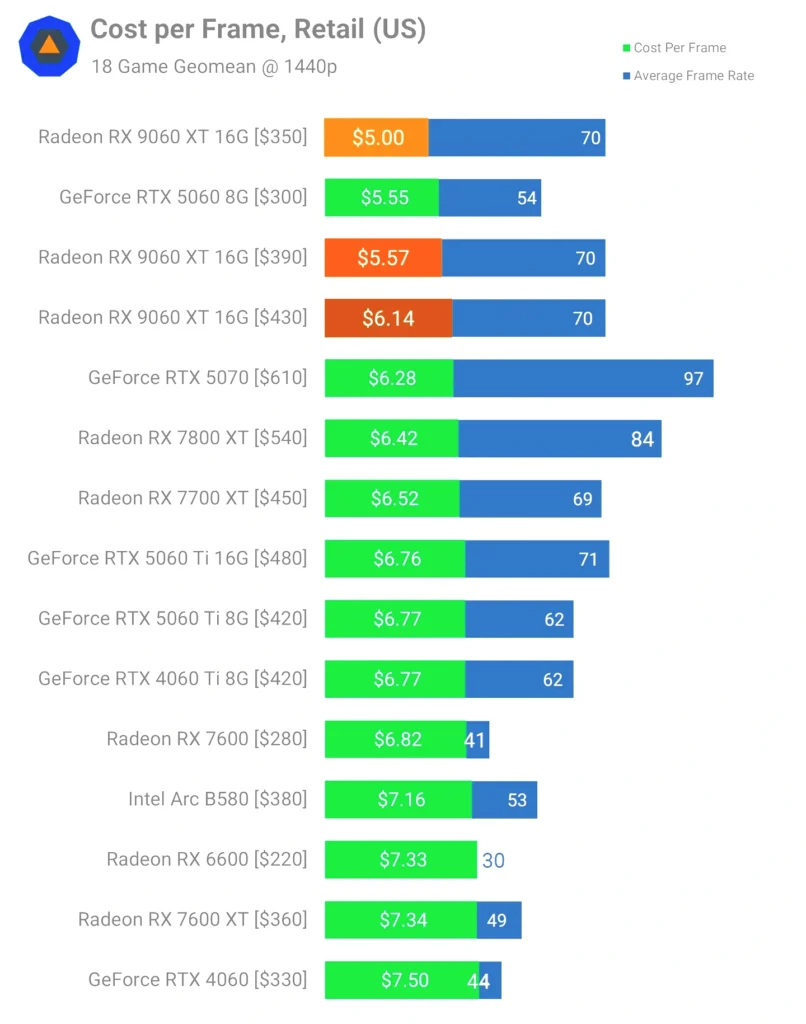
- At $350, the 9060 XT offers 26% better value than the RTX 5060 Ti 16GB
- At $390, that edge narrows to 18%
- At $430, it shrinks further still, down to just 9%
Two Cards, One Name
Everything above describes the 16GB card. AMD also sells an 8GB version under the exact same 9060 XT name, a decision that hands buyers a real chance of paying similar money for a much weaker product without realizing it. TechSpot’s review of that 8GB card reads nothing like the 16GB numbers here, and the two shouldn’t be confused for variants of the same purchase.
The practical advice is blunt: skip every 8GB listing when shopping for a 9060 XT. Check the VRAM figure on every listing before checking the price, because the name alone won’t tell the two cards apart.
The Resale Problem
The cost of getting this wrong doesn’t stop at launch-day performance. 8GB cards tend to depreciate faster and resell for less down the line, so the mistake compounds rather than staying fixed at whatever was paid on day one.
One more practical note for whichever 9060 XT ends up in the build: at this performance tier, turning ray tracing off yields higher FPS and lower latency, and for most games at 1440p that trade is the smarter one to make.
The Rest of TechSpot’s 9060 XT Test Bench
A GPU review is only honest if the processor sitting next to it can’t hold the result back, which is the whole reason a CPU this expensive shows up in a $350 graphics card test. Any bottleneck that shows up in these charts has to be the RX 9060 XT itself, not a processor running out of headroom before the GPU does.
| CPU | AMD Ryzen 7 9800X3D |
| Motherboard | MSI MPG X870E Carbon WiFi |
| Memory | G.Skill Trident Z5 RGB DDR5-6000 CL30 |
| BIOS Setting | ReBAR Enabled |
Aggregate benchmarks say what a chip can do across a thousand test runs, but they can’t say what it feels like to sit in front of one every day. One Steam user with an all-Radeon system posted exactly that account after moving a rig from a Core i5-14600K to a Ryzen 7 7800X3D, and the gap between what the spec sheet promised and what actually showed up at the desk is the whole reason it’s worth reading.
Gaming and Daily Use, Side by Side
- Borderlands 4 ran 5% faster on the 14600K by the counter, yet felt smoother on the same chip anyway, since the 7800X3D showed slightly more stutter despite the higher average underneath it.
- BF6 came out identical on both platforms at 1440p, because the GPU was the limit long before either CPU had anything left to give.
- Firefox running privacy add-ons felt noticeably snappier on the 7800X3D, the kind of difference that shows up in everyday browsing rather than in any benchmark run.
- Sticking with an all-Radeon build sidestepped an iGPU bug that had been hitting Silent Hill 2 on mixed-vendor systems, a bonus that had nothing to do with either CPU’s own performance.
What Cinebench Said Versus What the Desk Felt
| CPU | Cinebench R23 (Stock) |
|---|---|
| Intel Core i5-14600K | 26,882 |
| AMD Ryzen 7 7800X3D | 18,133 |
26,882 against 18,133 is not a close race on paper, the 14600K ahead by nearly 50% in Cinebench R23 at stock settings. And yet the user reported that lead never translated into a real wait at the desk, which says more about how far modern CPUs have pushed multi-core rendering than it does about either chip specifically.
Bandwidth, Latency, and Why X3D Changes the Math
On raw memory numbers, the Intel platform wasn’t close: higher bandwidth and lower latency, the kind of advantage that normally shows up directly in gaming frame times. But 3D V-Cache exists precisely to make that advantage irrelevant, feeding the 7800X3D’s cores from a much larger on-die cache instead of leaning on the memory controller the way a standard Ryzen chip has to.
The AM5 Memory Sweet Spot
Anyone building on AM5 should treat DDR5-6000 as the target rather than chasing higher-rated kits: it’s the point where the platform’s memory controller and infinity fabric stay in sync, and the user’s own tuning settled there as the best latency result on the new build.
After running both chips through games, browsing, and rendering, the verdict wasn’t a coronation for either side, just a plain read on where each one actually wins.
Ryzen 7 5800X3D on AM4
The Ryzen 7 5800X3D packs 96 MB of L3 cache onto a socket AMD first launched in 2017, which is why it’s become the default answer for anyone still running an AM4 motherboard who wants more gaming performance without a platform change. Drop it into a board that’s already hosted three or four generations of Ryzen chips and the cache, not the clock speed, is what does the work.

5800X3D vs Ryzen 5 9600X: Specs
| Specification | Ryzen 7 5800X3D | Ryzen 5 9600X |
|---|---|---|
| Cores / Threads | 8 / 16 | 6 / 12 |
| Base / Turbo Clock | 3.4 / 4.5 GHz | 3.9 / 5.4 GHz |
| L3 Cache | 96 MB | 32 MB |
| TDP | 105W | 65W |
| Socket | AM4 | AM5 |
The two chips split their advantages cleanly on paper. The 5800X3D carries eight cores against six and triples the L3 cache, while the 9600X answers with a higher base and turbo clock and a 65W TDP against the older chip’s 105W, a gap that works out to the 5800X3D drawing about 47% more power. Neither spec sheet wins outright; they’re built for different jobs.
Productivity Benchmarks: 5800X3D vs 9600X
The 5800X3D was built to win frame-rate charts, not rendering benchmarks, so the productivity numbers below are really a test of how much that specialization costs against a newer, more balanced chip.
Cinebench 2024 (Single-Core)
Cinebench 2024 (Multi-Core)
Geekbench 6 (Single-Core)
Geekbench 6 (Multi-Core)
PassMark CPU Mark
Blender CPU Score
The 9600X wins every chart here, and its widest margin comes in Geekbench 6 single-core, where its higher clocks and newer architecture pull well ahead of the 3D-cache chip’s per-thread ceiling. But the gap nearly closes in Blender, 212.46 against 218.13, which is the one place the 5800X3D’s extra cores make up almost all of what its clock speed gives away elsewhere.
5800X3D vs Intel Core i5-14600K
The Core i5-14600K was the chip most often set against the 5800X3D during this generation, and it’s the closer apples-to-apples matchup for a gamer weighing a same-era build rather than a jump to AM5.
- At 1440p, the Core i5-14600K games about 8.3% faster than the 5800X3D
- The 5800X3D holds a clear power efficiency advantage over the 14600K
- The 5800X3D runs about 4.3% cooler than the 14600K
- The 5800X3D launched at $449 MSRP against the 14600K’s $319
None of that 8.3% gaming deficit or the $449 launch price matters much on its own; what matters is that the 5800X3D slots into a motherboard someone already owns, while the 14600K’s small lead comes bundled with a new board and new memory. For anyone still on AM4, that’s the whole decision.
The Ryzen 5 9600X arrived more than two years after the 5800X3D, and that gap shows up in more than a benchmark chart. It’s a newer platform underneath, not just a newer chip, and for a lot of buyers that platform is the actual purchase.
What AM5 Adds Beyond the Chip Itself
- Unlocked multiplier, so overclocking headroom is there for anyone who wants to chase it
- Support for up to 192GB of DDR5-5600, memory that’s both faster and denser than anything the 5800X3D’s AM4 board can run
- An integrated Radeon 610M GPU, giving the system a display output even before a graphics card goes in, something the 5800X3D can’t do at all
- 75% higher theoretical memory bandwidth than the 5800X3D
- PCI Express 5.0 support, two generations ahead of what the 5800X3D’s platform offers
- 28 PCIe lanes against the 5800X3D’s 20, more room for a fast SSD and a GPU to both run at full speed
Where NanoReview’s Composite Scores Land
NanoReview’s composite scoring puts the 9600X ahead across every category it tracks, and the final tally reflects it: 71 against the 5800X3D’s 52. That’s not a photo finish decided by one benchmark run; it’s a chip ahead on single-core work, multi-core work, and efficiency all at once.
| NanoReview Metric | Ryzen 7 5800X3D | Ryzen 5 9600X |
|---|---|---|
| Final Score | 52 | 71 |
| Single-Core Performance | 60 | 90 |
| Multi-Core Performance | 39 | 46 |
| Power Efficiency | 54 | 70 |
Price and the Cost of Running It
The 9600X sells for $175 against $346.81 for the 5800X3D, and PassMark’s CPU Value rating, which weighs performance against price, comes out more than double in the 9600X’s favor. A chip that costs half as much and still wins NanoReview’s single-core and multi-core comparisons isn’t a compromise pick, it’s just the better number on both sides of the ledger.
PassMark puts the 9600X’s estimated yearly running cost at $11.86, against $19.16 for the 5800X3D. That’s a small gap in dollars, but it stacks on top of a lower purchase price rather than offsetting it.
Ryzen 7 5700X on AM4
AMD launched the Ryzen 7 5700X on April 4, 2022 at a $299 MSRP, positioning it as the budget entry point into a socket that was already three generations deep by then. For anyone with an AM4 board already in hand, that price bought a modern eight-core chip without the cost of a platform change.
| Cores | 8 |
| Threads | 16 |
| Base Clock | 3.4 GHz |
| Boost Clock | 4.6 GHz |
| L3 Cache | 32 MB |
| TDP | 65W |
| Socket | AM4 |
| Launch MSRP | $299 |
The chip it gets cross-shopped against most is Intel’s Core i5-14400F, and the two benchmark aggregators that cover both don’t agree on which one wins.
PassMark CPU Mark
Technical.city’s aggregate benchmarks put the 5700X 4% ahead, the same direction PassMark’s CPU Mark scores point, yet the site itself won’t call a winner from that margin. A 4% gap is small enough that it says more about how close these two chips sit than about which one to buy.
UserBenchmark’s numbers point the other way. The i5-14400F comes out ahead across most of its test categories, and the 5700X only takes the lead in one of them: the 8-core overclocked speed test.
UserBenchmark 8-Core Overclocked Speed
Core i5-14600K Against the Ryzen X3D Chips
PC Guide put the 14600K up against the 5800X3D directly, a matchup that pits Intel’s newer mainstream chip against a cache-heavy design that’s still holding its own in gaming charts years after launch.
| Specification | Intel Core i5-14600K | AMD Ryzen 7 5800X3D |
|---|---|---|
| Cores (P+E) / Threads | 14 (6+8) / 20 | 8 / 16 |
| Boost Clock | 5.3 GHz | 4.5 GHz |
| L3 Cache | 24 MB | 96 MB |
| TDP | 125 W | 105W |
| Launch MSRP | $319 | $449 |
The 14600K’s 14 cores and 5.3 GHz boost clock outrun the 5800X3D’s 8 cores and 4.5 GHz on paper, but the 5800X3D answers with 96 MB of L3 cache against the Intel chip’s 24 MB, the four-times gap that’s kept it relevant in gaming benchmarks long after its 2022 launch. Intel priced the 14600K at $319 against the 5800X3D’s $449 MSRP, a $130 difference that puts more of the platform budget back in the buyer’s pocket.
PC Guide’s overall verdict came down on the side of the 14600K, cache advantage or not.
One Owner’s Move from the 14600K to a 7800X3D
On the same user’s rig, the 14600K put up 26,882 in Cinebench R23 against the 7800X3D’s 18,133, a lead of nearly nine thousand points that has nothing to do with gaming and everything to do with the 14600K’s extra cores doing extra work.
None of that Cinebench lead showed up in Battlefield 6, where the user reported identical performance between the two chips once the GPU became the bottleneck. A processor that wins a multi-core benchmark by nine thousand points can still hand back nothing at all once the graphics card runs out of headroom first.
The user summed up what months of running both chips had actually taught them.
Neither chip loses this comparison so much as it answers a different question: the 14600K is the pick for workloads that chew through cores, the 7800X3D for the games that reward cache over clock speed, and the buyer’s own usage decides which number in that Cinebench chart actually matters to them.
January 2024 is when the Core i5-14400F showed up, carrying a $196 MSRP that undercuts most of what AMD offers on AM4 or AM5 at the entry level. Technical.city counts that as a one-year age advantage over the Ryzen 7 5700X, and for a chip this cheap, a year of extra silicon maturity is not nothing.
| Cores | 10 (6 Performance + 4 Efficient) |
| Threads | 16 |
| Base Clock | 2.5 GHz |
| Boost Clock | 4.7 GHz |
| L3 Cache | 20 MB |
| TDP | 65W |
| Socket | FCLGA1700 |
14400F vs 5700X: The Numbers
Two separate testing sources, Geekbench 5 and UserBenchmark, put the 14400F ahead of the 5700X, and the hybrid core layout that mixes six Performance cores with four Efficient ones is doing real work in both.
GeekBench 5 Single-Core Performance
GeekBench 5 Multi-Core Performance
UserBenchmark’s own aggregate, effective speed, tells the same story its Geekbench numbers do: the 14400F comes out ahead of the 5700X there too.
- UserBenchmark scores the i5-14400F 11% faster in effective speed than the Ryzen 7 5700X.
- The i5-14400F leads the 5700X across every one of UserBenchmark’s core-count speed tests, single-core through multi-core.
What the Price Difference Buys
Technical.city puts the 14400F 79% ahead on value for money, and the current pricing backs that up: $274 for the Intel chip against $310 for the 5700X on UserBenchmark, which scores the 14400F’s value rating 15% higher on top of the lower sticker itself. A chip that costs less and benchmarks higher on both single-core and multi-core Geekbench runs isn’t a marginal case for the budget build, it’s the obvious one.
Builders have already made this call themselves: UserBenchmark’s data shows the i5-14400F holding nearly five times the market share of the Ryzen 7 5700X.
Intel spent much of the last year fielding complaints about 13th and 14th Gen desktop chips crashing in games and rendering workloads, and unlike a lot of forum-driven panics, this one ended with Intel itself confirming a root cause rather than shrugging it off as isolated user error.
Anyone running a 13th or 14th Gen desktop chip should know this
Intel has confirmed the instability traces to a clock tree circuit that ages under elevated voltage and temperature, shifting its duty cycle over time. i9 owners have reported the pattern directly: no problems at first, then degradation building quietly over months before instability shows up all at once.
Intel’s Official Root Cause
The explanation Intel settled on is a clock tree circuit that wasn’t built to survive the voltage and temperature these chips were routinely hitting. Under that stress the circuit ages, and as it ages its duty cycle shifts, which is a fancy way of saying the clock signal itself stops being reliable. Once the clock driving the core is no longer trustworthy, nothing downstream of it can be either.
- Motherboard power delivery configurations that exceeded Intel’s own guidance
- An overly aggressive eTVB algorithm that let i9 chips run hotter than intended
- An SVID microcode algorithm that was requesting damaging voltage levels in the first place
- Elevated voltage requests even during idle periods, when the chip should have been under the least stress
The Microcode Fix
Intel’s answer to all four triggers came as microcode 0x12B, which folded the earlier 0x125 and 0x129 patches into one update rather than leaving owners to track which partial fix they’d installed. That update still had to reach owners through motherboard vendors as a BIOS flash, and Intel expected the rollout across the board landscape to take several weeks, meaning plenty of chips kept running unpatched well after the fix existed.
The obvious worry with any fix like this is whether it claws back performance to buy stability, and Intel’s own testing put 0x12B’s impact within normal run-to-run variation, meaning the difference is small enough to disappear into the noise of just rerunning the same benchmark twice.
The problem is also narrower than the headlines made it sound. Intel has said the 13th and 14th Gen mobile chips aren’t affected, and neither are Lunar Lake or Arrow Lake, so this is a desktop-specific issue tied to a specific generation rather than something carrying forward into what Intel is shipping now.
What Owners Are Actually Reporting
The community accounts line up with the technical explanation in an unsettling way: months of normal operation followed by instability that shows up seemingly out of nowhere. Affected users found they had to either raise voltage or cut boost clocks just to get a stable system back, and the part that should worry anyone shopping used or discounted stock is that this hit people who’d undervolted and never touched an overclock. Community reports also suggest the problem wasn’t confined to the flagship i9 chips, which undercuts any assumption that sticking to a cheaper SKU sidesteps it.
Owners running DDR5 above 4200 MT/s ran into a separate stability concern tied to the integrated memory controller, stacking a second variable on top of the clock tree issue for anyone chasing high-frequency memory kits.
The story didn’t stop at 0x12B either. Intel followed up in May 2025 with microcode 0x12F, specifically targeting the idle-voltage scenario, which suggests the fix that was supposed to close the book on this needed a sequel almost a year later.
A patch that arrives more than a year after the original fix, for a root cause described as physical aging in the silicon itself, is exactly the kind of detail that leaves buyers asking whether microcode was ever going to be enough. One commenter put the doubt plainly.
Don’t the 13th and 14th gen still have hardware level defects? Making the whole comparison at the beginning moot?
AM4 to AM5 Upgrade Economics
AMD listed the Ryzen 7 5800X3D roughly 40% above the Core i5-14600K’s MSRP, a gap that’s supposed to buy a socket you already own rather than a new motherboard and new memory. On paper that math still favors AM4. In practice, street pricing and what it actually costs to fill out an AM5 build have started to erase that advantage entirely.
A Nanoreview reader poll put that sentiment in numbers: 82.1% picked the Ryzen 5 9600X over the Ryzen 7 5800X3D, which took just 17.9% of the vote. That’s not a close call, and it’s a strange result for a chip with 96 MB of L3 cache going up against a mainstream part with none of that gaming advantage on paper. The vote isn’t about gaming performance at all; it’s about what the total bill looks like once the platform is factored in.
One commenter did the arithmetic on exactly that, pricing out a full 9600X and DDR5 kit against a standalone 5800X3D in their own market.
Amd 9600x (180€)+ 16gb ddr5 (200€) combo is cheaper than 5800x3d. Talk about bs price. 200€ would be the only price worth considering this, now, 4+ years old cpu.
That kind of math doesn’t hold everywhere the same way, and regional pricing can push it even further out of AM4’s favor. One buyer in Romania found the 5800X3D priced high enough against current AM5 chips that staying on the old socket stopped making sense at all.
In my country – Romania, I estimated an absurd price for the 5800x3d compared to the 7000 or 9000 series, so I pulled the trigger on a whole pc upgrade since I already had a 9070 XT.